What is Business Process Modeling And How it Can Help
- Bioinformatics , BPM Techniques , Data Flow Diagram , Flow Chart , Process modeling
- Bio Informatics, BPM Techniques, Data Flow Diagram, Flow Chart, Process Modeling
What is Business Process Modeling: Decision-making is the executives’ daily bread. Top managers rely on data and details to optimize corporate operations. They often incorporate business process modeling to speed things up and reduce risks. Read on to learn what BPM is and what it can do for you.
Business process modeling is a visual display of the company’s processes or workflows. It orders various actions into a sequence to facilitate the analysis and improvement steps for a particular process.
What is Business Process Modeling, Goals, Benefits, And Techniques
The Goal Of Business Process Modeling
BPM is flexible and can have several purposes. In essence, it aims to help you understand a certain process better. Its visual aspect allows you to see different components and how they relate to each other. The results of implementing BPM are easy to understand for the more technically, as well as non-technically inclined organization members, who are all provided with insights that serve as the basis for further improvements.
Also Check: Tips for Making an Effective Small Business Website 2025
Ways in Which BPM Improves Your Processes
There are several reasons why you should consider implementing business process modeling.
- It clearly defines the boundaries of a process.
- BPM helps you organize and control a process.
- It allows you to standardize things.
- BPM helps you to eliminate risks by modeling future changes.
What Makes Up The Business Modeling Process?
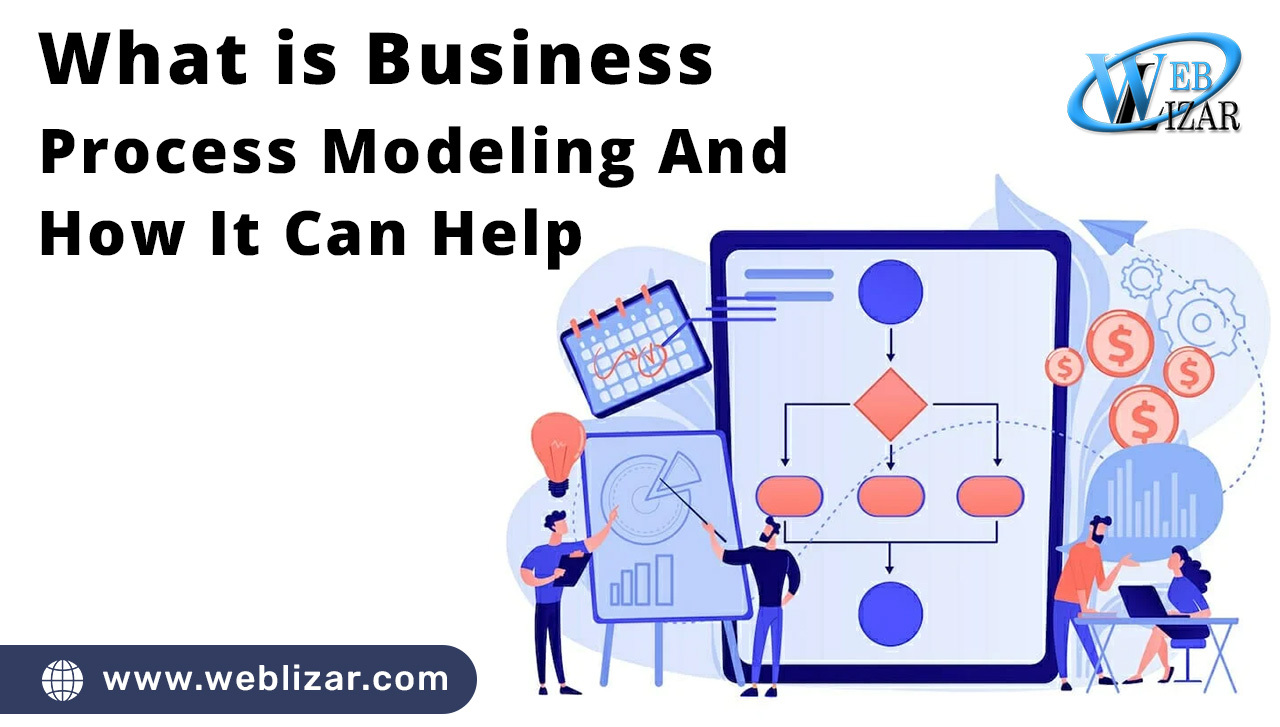
BPM can result in a Gantt chart, flow chart, or data flow diagram. It also has 3 main constituents: events, activities, and gateways. An event indicates the start and end of a particular activity.
A rectangle represents an activity and can be used to show steps in a process. A gateway shown as a diamond denotes potential turns an activity can take. A sequence flow arrow connects the elements. BPM starts with defining a process. Then, the process has to be understood. Next comes analysis, involving looking at weaknesses and their impact on the greater process. Finally, you can redesign the process and implement the changes.
BPM Techniques
Business process modeling can be expressed in several ways.
Also Check: 15 Tips To Create The Perfect Website For Your Business
● Flowchart
Allows you to divide a process into several stages so that you can see how they relate to one another.
● Gantt chart
Shows you the whole project timeline, including the tasks and resources it requires.
● Data Flow Diagram
Provides a visual representation of the flow of information in a process.
BPM at Work
Here’s a flowchart of particular elements of a material management workflow. All its elements have been extracted and put in a logical order. The gateways show yes/no questions to help you decide how to proceed. You can make your flowchart more detailed, should the need be.
Besides the elements shown here, you can also include sub-processes, predefined processes, and documents. If you want to get more grainy and show particular tasks as well as follow their progression, you might want to go for a Gantt chart. Here’s a sales team’s Gantt chart where every major element is divided into smaller tasks and you can see progress bars that let you know how much work’s left.
Bioinformatics Process Modeling
Synergy Codes has developed an app that allows its users to model bioinformatics processes and associated tools. Essentially, the users can break down a complex process into a simple journey and get a clear description of it.
Also Checkout: Top 10 Benefits of Managed IT Services: For Business 2025
Do I Need a BPM App?
Utilizing a business process modeling tool generates several advantages. These include minimizing risks, accelerating decision-making, and improving overall efficiency. At Synergy Codes, we believe that it’s better to skip an off-the-shelf solution and go with a custom one.
If you’d like to discuss the details of implementing a BPM app like this in your organization, contact us today.
school management


Leave a Reply